In plain English
Suppose you posted 10 calls on Polymarket last month and 7 of them came in correct. A 70% strike rate sounds good. The trouble is that the number tells you almost nothing about whether you actually have skill at forecasting, or whether you got lucky on a friendly question set.
Brier Score is the metric that closes that gap. It is the simplest, oldest, most useful answer to one question every prediction-market trader needs to ask: are the probabilities I put on outcomes any good?
Why hit rate fails you
A forecaster who says ‘Yes’ to every contract priced above 50 cents on Polymarket or Kalshi will, over time, look like they win about 7 trades out of 10. Not because they have any insight. Because the prices they are agreeing with are usually well calibrated. The market did the work; the forecaster just nodded along.
That is the failure mode hit rate hides. It rewards agreeing with the consensus and punishes nothing. Two forecasters with the same 70% strike rate can be running radically different quality books. One might be calling 90 on markets that resolve 90% of the time. The other might be calling 65 on markets that resolve 70%. The first is doing real work. The second is along for the ride. Hit rate cannot tell them apart.
The fix is to stop counting wins and start measuring how close your stated probabilities were to the truth.
How Brier Score is actually calculated
The Brier Score for a single prediction is the squared difference between the probability you stated and the outcome that occurred. Outcomes on prediction markets are binary: a contract resolves to 0 (No) or 1 (Yes).
BS = (your probability − outcome)2
Average that across every prediction you ever logged and you have your mean Brier Score. Lower is better.
Worked example · 3 calls, 3 Briers
A confident right call earns a great score. A confident wrong call is punished roughly twenty times harder than a hedged one. There is no upside to overstating your conviction.
This is the property mathematicians call strictly proper. Glenn Brier proved in 1950 (Monthly Weather Review, Vol. 78, No. 1) that under this scoring rule, the way to minimise your expected score is simply to report the probability you actually believe. Rounding off, hedging toward 50/50 to look modest, all of it gets punished in expectation. There is nowhere to hide.
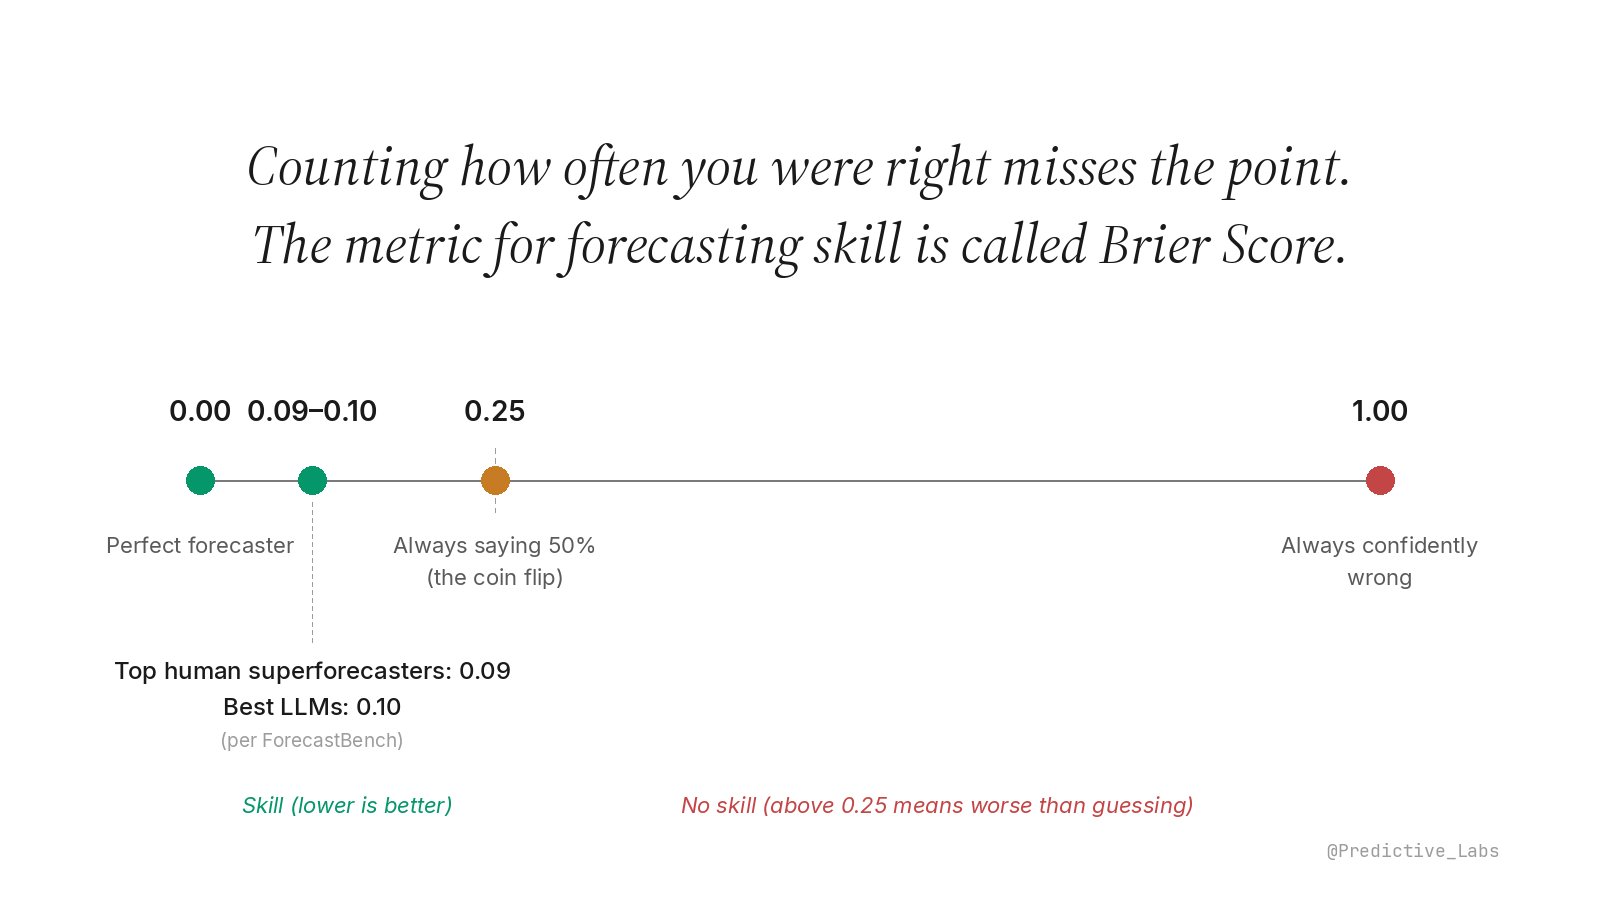
What counts as a good Brier Score?
The scale runs from 0 (perfect calls every time) to 1 (confidently wrong every time). The four anchor points worth memorising:
Scale is non-linear. The skill region (0 to 0.25) is expanded so the band where real forecasters live is visible.
Top human superforecasters on ForecastBench, the leading public benchmark, score around 0.086 on its most recent leaderboard. The best frontier LLMs (CassiAI ensemble and xAI Grok 4.20 in early 2026) sit at 0.103, closing the gap with humans but not yet there. 0.25 is what you get by calling 50% on every contract, the coin flip baseline. Above 0.25 is genuinely worse than guessing.
For prediction markets specifically, Polymarket reports an aggregate Brier of around 0.084 across all resolved markets on its public accuracy page. In other words, market prices themselves are extraordinarily well calibrated. That is the bar an individual forecaster has to clear before they can call their edge real.
What Brier Score does not tell you
Brier is one number. It tells you, on average, how close your probabilities were to outcomes. It does not tell you where your errors live. A forecaster who is well calibrated at low probabilities but systematically overconfident at high ones can post a respectable Brier and still be the trader most likely to blow up. Two forecasters with identical Brier scores can be running very different books, in different directions, on different categories.
Brier also depends on the questions you took on. A forecaster who only takes long-shot tail bets sees different scores than one who works the middle of the distribution, even at the same skill level. Comparing raw Brier across very different question mixes is misleading without adjustments.
And critically, Brier only works if you logged your own probability before the market resolved. Polymarket and Kalshi store the market’s price. They do not store yours. Without your own record, the gap between your view and the market’s is hindsight, not measurement.
How this lives in nijinn
Brier Score is the headline metric on the Performance Audit Surface. nijinn captures your stated probability at the moment you size a position, locks it, and grades it against the realised outcome at resolution. The score is decomposed so you can see whether you are losing points on calibration (your numbers are systematically off in one direction) or on resolution (your numbers do not carry information). Different problems, different fixes.
The metric pairs naturally with the Calibration Curve, which shows where in the probability range your error lives, and with sizing discipline like Quarter Kelly, which translates the skill measurement into bankroll survival.
Brier’s lasting virtue is that it makes honesty cheaper than dishonesty. A trader who logs probabilities and grades them weekly has nowhere to hide a story. The distinction between a desk that knows it has edge and one that hopes it does is the whole point of the metric.