In plain English
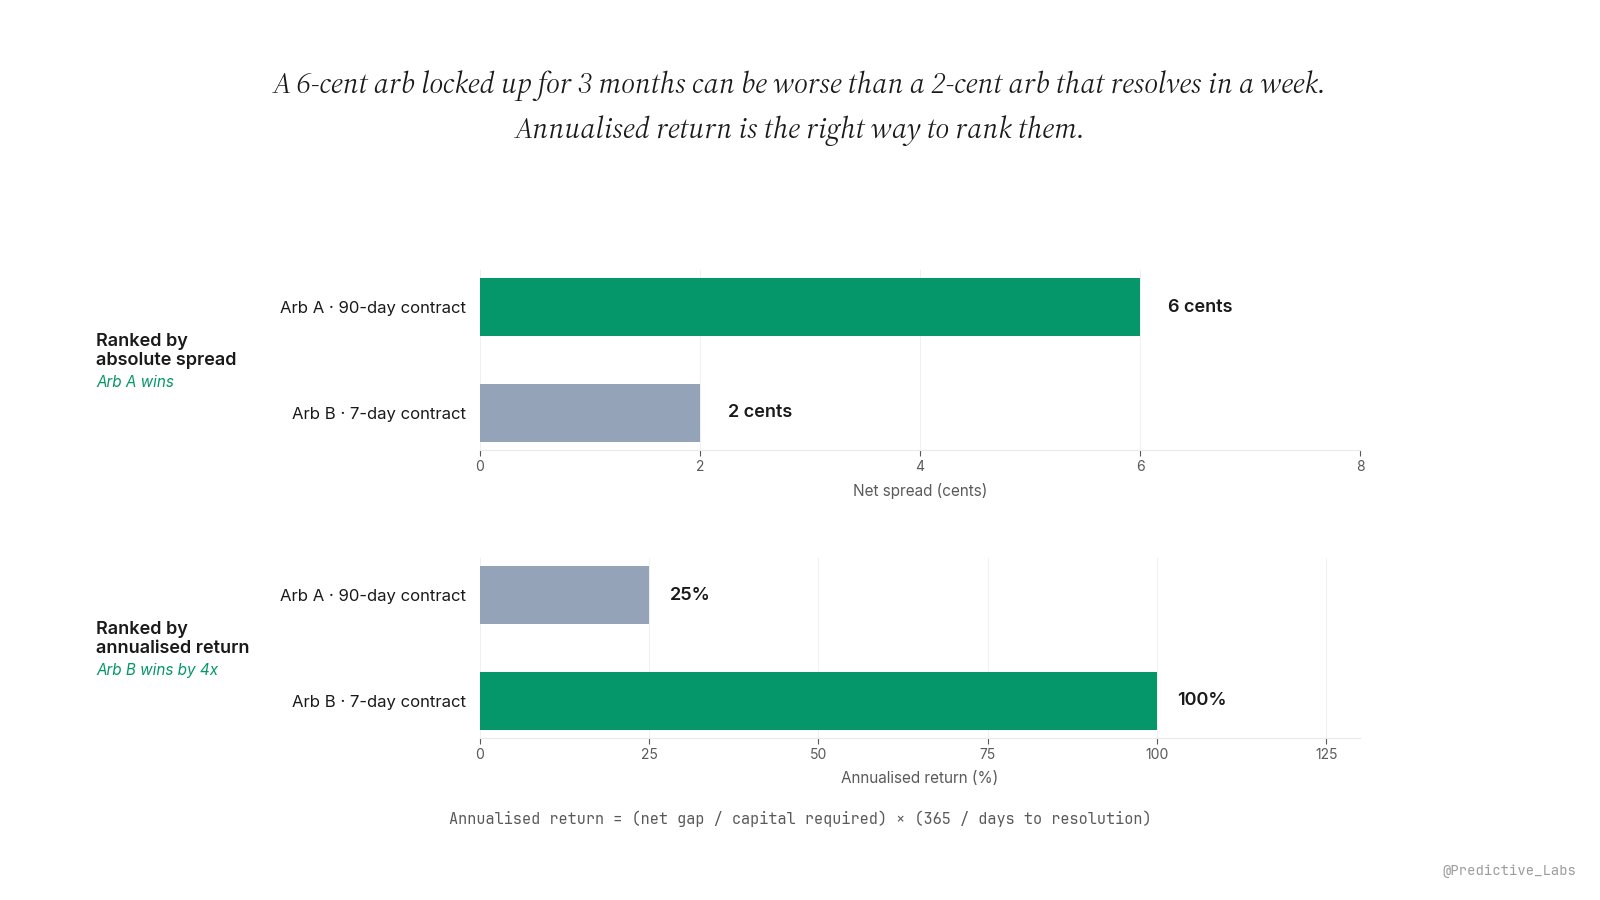
A trader screens two arbitrage candidates on Polymarket and Kalshi. The first shows a 6-cent net gap on a contract that resolves in 90 days. The second shows a 2-cent net gap on a contract that resolves in 7 days. Both opportunities use the same capital base. The trader picks the bigger spread, because the bigger spread is the bigger profit per contract.
The trader has just made the wrong call by a factor of 4. The 6-cent arb earns roughly 25 percent on the deployed capital when scaled to a year. The 2-cent arb earns roughly 100 percent. The smaller absolute gap is the larger return on the only thing that matters: a dollar of capital working for a unit of time. This entry is about the simple formula that flips the ranking and the discipline that makes the formula useful.
Why ranking arbs by absolute spread misallocates capital
The headline spread tells the trader how much an arb pays per contract pair. It does not tell them how long their capital has to sit there to collect that payment. Two arbs with identical spreads but different durations are not the same trade. One frees the capital quickly to redeploy elsewhere; the other holds it hostage for the entire window.
The cost of that lock-up is not a soft preference, it is a measurable opportunity cost. Every day the capital is in the 90-day arb is a day it cannot be in another arb. If the average available arb in the universe earns 50 percent annualised, the long-locked 25-percent position is costing 25 percent annualised in foregone returns the entire time it sits. The trader sees the 6 cents on the screen and feels good. The portfolio sees the gap to its potential return rate and underperforms.
The fix is to rank candidates on a metric that already accounts for duration. That metric is annualised return.
The annualised return formula, plainly
The simple annualised return on an arb position is:
Annualised return = (net gap / capital required) × (365 / days to resolution)
The numerator is the dollar profit per unit of capital deployed. For a Polymarket-Kalshi arb, capital required is typically the maximum payout of one contract pair (around $1 per contract for the standard YES-on-one-venue plus NO-on-the-other structure), so the ratio is just the net gap expressed as a percentage of that $1. The 365-over-days factor scales the one-cycle return up to a one-year-equivalent rate.
Worth flagging the formula choice. There are two annualisation conventions in finance. The simple form above treats each arb as a one-shot return that is linearly scaled to a year. The geometric form, (1 + return)(365/days) − 1, assumes the trader can compound their gains by reinvesting in identical arbs continuously. For ranking candidate arbs, simple is the right choice: it does not assume a follow-on opportunity exists, and it lets two arbs of different durations be compared on the same scale without baking in an unstated reinvestment assumption. The geometric form is the right tool when projecting actual portfolio compounding, which is a different question.
The 365 in the numerator is correct for prediction-market capital. PM contracts hold capital across weekends and holidays (not just trading days), so the equities convention of 252 trading days does not apply, and neither does the money-market convention of 360. Use 365.
Three arbs ranked by annualised return
Same capital base, three different annualised returns. The bottom row has triple the headline spread of the top row, and one quarter of the annualised return. The ranking by absolute spread is exactly inverted from the ranking by capital efficiency.
Why short-cycle arbs compound and long-cycle arbs accumulate risk
Two distinct effects make short-cycle portfolios outperform a single long-cycle position even at the same nominal annualised return.
The first is mathematical. Thirteen consecutive 7-day arbs at 2 percent each, redeployed without idle time, compound to (1.02)13 − 1 = 28.0 percent over a 91-day window. A single 90-day arb at the same 25 percent simple-annualised rate returns only 6.16 percent over the same window. Same nominal annualisation, roughly 22 percentage points more actual return from the compounding. The short-cycle stack collects each gain and puts it back to work on the next opportunity; the long-locked single position cannot do that until it resolves. The caveat is that the 28 percent assumes the short arbs really are available back-to-back. If the pipeline runs dry between cycles and capital sits idle, the gap shrinks. Annualised return tells the trader the per-cycle rate; what they actually capture depends on how full the pipeline stays.
The second effect is risk accumulation, and it favours short cycles for reasons that have nothing to do with compounding. A long-locked PM arb carries three exposures that grow with time: venue risk (a Polymarket or Kalshi rule change, a freeze, a regulatory action, a delisting), oracle risk (for contracts that resolve via an external data source or a UMA-style optimistic oracle, the risk that the resolution mechanism returns a contested or delayed value), and resolution-wording risk (the risk that an outcome falls into ambiguous territory the contract language did not cleanly cover). All three are step functions: small probability per day of holding, but the longer the hold, the more cumulative probability that one of them lands. A short-cycle portfolio resets that exposure with every redeployment, and gives the trader a fresh diligence pass each cycle to walk away from any thesis that has deteriorated since entry.
How to use annualised return in practice
Three operating rules.
1. Compute net gap before annualising. The annualised return formula is only useful if the numerator is honest. Net gap means the spread that survives fees, slippage, and execution friction (the topic of the fee-aware net gap entry). Annualising a gross spread that will not actually be captured produces a flattering number that does not survive contact with the order book.
2. Set a minimum-annualised threshold and filter the watchlist. The threshold depends on the trader’s capital cost and pipeline depth, but anything below the typical risk-free rate plus a sensible risk premium for venue and oracle exposure is not actually an arb, it is a long-locked low-yield position dressed up as one. A 10 percent annualised arb that locks for 60 days is rarely worth the operational overhead.
3. Treat selection and sizing as separate problems. Annualised return ranks which arbs to take. Quarter Kelly sizes how much capital to put into each one. A trader who confuses the two ends up either oversizing the headline-attractive arb or undersizing the high-annualised one. The two rules answer different questions and should be applied in sequence.
How this lives in nijinn
The Cross-Venue Arbitrage Surface in nijinn ranks every candidate arb by annualised return as the default sort, with absolute spread shown alongside but never used as the primary ranking. Net gap is computed live using the venue-correct fee schedules and a slippage estimate against the visible order book; the annualised number is then derived by dividing by the contract pair’s capital requirement and scaling by 365 over the days to resolution. A configurable minimum-annualised filter hides arbs below the trader’s threshold so the watchlist stays focused on capital-efficient opportunities.
The metric pairs naturally with fee-aware net gap as the upstream input and with Quarter Kelly as the downstream sizing rule. Together the three form the operational stack for a directional-and-arbitrage book: compute the honest net gap, rank by capital efficiency, size by edge.
The ranking that matters is annualised. The spread on the screen is just the cover.