In plain English
A trader buys 5,000 contracts of a 6-month Polymarket market at 65 cents. The bid-ask spread is 1 cent and the screen shows reasonable depth on the offer. They feel comfortable: the market is liquid. Five months later, with resolution two weeks away and a news event that has just shifted the contract toward 80, they try to close. The screen still shows a 1-cent spread. Their 5,000-contract sell prints back averaged at 71 cents against a displayed 80 offer. 9 cents of slippage per contract. $450 of unexpected cost on a position that looked liquid the whole time.
The market did not lie. The spread did. This entry is about the metric that catches what the spread does not, and how to put it on the same screen as the spread so a trader stops being surprised.
Why the spread you saw at entry can lie about exit cost
The bid-ask spread is a snapshot of one quantity at one moment. It captures the price gap between the best bid and the best ask, valid for the resting size at the top of book at that instant. It does not capture three things that matter for exit cost.
First, depth past the top of book. The 1-cent spread that quotes 200 contracts at 80 says nothing about whether the next 4,800 contracts sit at 80, at 78, or at 65. A trader sizing a 5,000-contract exit against a 200-contract top-of-book is walking the rest of the book by definition.
Second, time variation. Today’s 1-cent spread is not a forecast of the spread that will exist in five months, when the order book will have thinned in ways the entry-day screen could not show.
Third, regime change after news. A news shock that shifts the consensus probability triggers a temporary spike in absolute price moves while volume often does not keep pace proportionally. The spread on the screen seconds after the shock can look unchanged or only modestly wider, but the cost of placing a non-trivial order against it has become much higher than it was an hour earlier.
None of this is captured by the spread. Amihud is the metric that does capture it.
What the Amihud ratio actually measures
Amihud (2002) defined illiquidity as the daily ratio of absolute return to dollar volume, averaged over a window:
ILLIQ = average over the window of |Rd| / DVOLd
where Rd is the daily price return on day d and DVOLd is the dollar volume traded that day. The interpretation is the daily price response associated with one dollar of trading volume, which makes it a coarse proxy for price impact. A higher ILLIQ means each dollar traded moves the price more, which is what illiquidity feels like to a trader trying to clear size.
The standard practitioner version is the 21-trading-day rolling moving average (V-Lab and similar professional liquidity-monitoring stacks use this default). For prediction-market contracts whose holding periods are often shorter than equity trading horizons, a 7- or 14-day window can be more responsive without losing too much smoothing.
The measure was developed for equities. Translating to a Polymarket or Kalshi contract is direct: Rd is the daily change in the contract’s reference price, DVOLd is the contract notional traded that day. The mechanism (book depth absorbing demand) is the same. The caveat is that absolute ILLIQ levels are not comparable across asset classes; what matters is the relative change within a single contract over time.
Amihud computed across three days on the same contract
ILLIQ is scaled by 106 for readability per the V-Lab convention. The pre-resolution day shows roughly 130 times the price-impact-per-dollar of the quiet day, on the same contract, with a bid-ask spread that may not have moved at all.
Why illiquidity rises near resolution and after news shocks
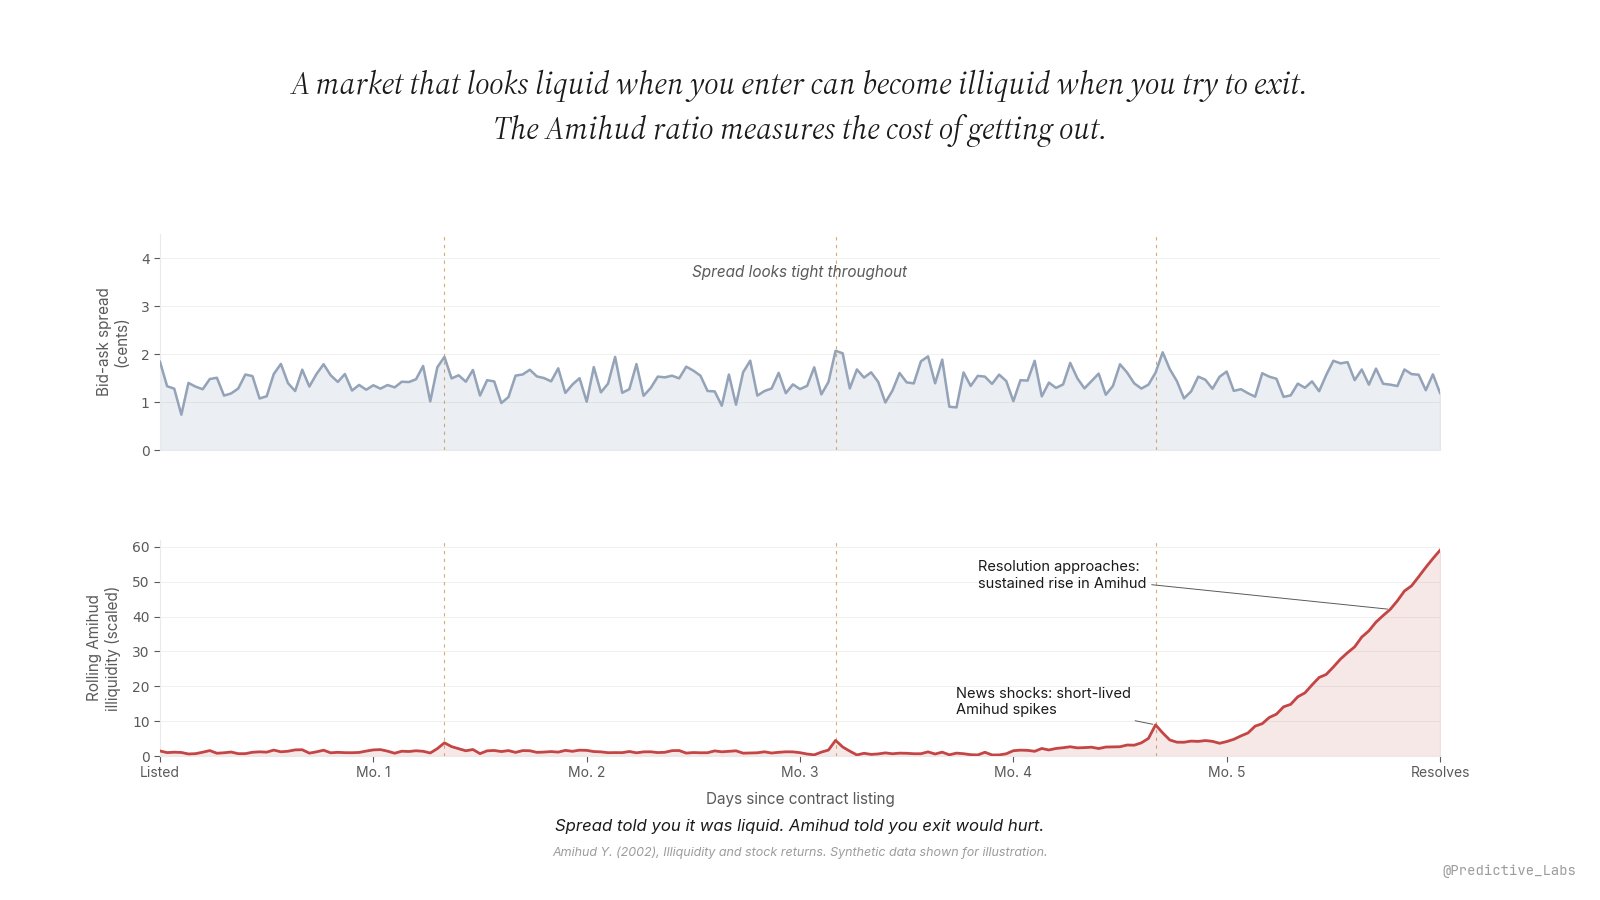
Two patterns dominate the time-series shape of Amihud on a typical prediction-market contract, and the diagram above shows them both.
The first is the news-shock spike. A material event (a debate, a Fed announcement, a court ruling, a sports result for an in-progress contract) causes |Rd| to jump. Volume often jumps too, but proportionally less, because the shock arrives faster than the order book can reload. The Amihud ratio rises, then decays back toward baseline within hours or days as the market makers re-quote. These spikes are short-lived. They are warning signals if the trader needs to exit during the spike, but they tend not to persist.
The second pattern is the resolution-approach climb, and this one matters more. As the contract converges toward its eventual $1 or $0 resolution, three things happen at once. Market makers gradually withdraw quotes, because the upside on quoting near a binary outcome shrinks as time decays. Dollar volume thins for the same reason. And the trades that do clear are increasingly information-driven (someone closing a position who has new information) rather than noise. Each of these compounds. |Rd| rises slightly while DVOLd falls substantially, and the ratio climbs over weeks. The bid-ask spread can remain almost unchanged through this entire period because the top-of-book quotes are still narrow even as the book thins beneath them. Amihud is the early-warning metric. The spread is a lagging one.
How to use rolling Amihud on a Polymarket or Kalshi watchlist
Three working rules for putting Amihud to operational use.
1. Display rolling Amihud next to the bid-ask spread on every watchlist contract. The two metrics together carry far more information than either alone. A tight spread combined with a flat low Amihud is a genuinely liquid market. A tight spread combined with a rising Amihud is a market faking liquidity, often a contract that is approaching resolution or that has just absorbed a news shock.
2. Track the relative change, not the absolute level. Amihud values across contracts are not directly comparable; the absolute number depends on the typical dollar volume of the venue and the price scale. What matters is whether a given contract’s Amihud is 1x its baseline or 5x its baseline. A 3-5x rise from the contract’s own historical mean is the threshold at which exit costs have become multiples of entry costs.
3. Take action when Amihud rises against you. If Amihud is climbing on a contract you hold, three responses in order: reduce position size before the climb continues; avoid placing large new directional positions on that contract; and on any planned exits, add a slippage budget that scales with the Amihud reading rather than with the spread. The trader who waits for the spread to widen before reacting is the trader who pays full slippage.
How this lives in nijinn
The Performance Audit Surface in nijinn computes rolling Amihud per contract from the venue’s daily price and volume history, and renders it alongside the bid-ask spread on the same panel so the two patterns above (news spike, resolution climb) are visible at a glance. The 21-day moving average is the default; the window is configurable for shorter-horizon contracts.
The metric pairs naturally with the fee-aware net gap entry on the arbitrage side, since slippage is the same family of cost in different clothes, and with the hedge ratio entry on the hedging side, since unwinding a hedge near resolution is one of the most common situations in which entry liquidity and exit liquidity differ by an order of magnitude.
The spread is the price you see entering. Amihud is the price you will pay leaving.